Problem
A security tool protects only the assets it knows about, and the CMDB is meant to list every asset that should be protected. In practice the two disagree: some CMDB assets never received an agent or a scan, and some assets the tools see are missing from the CMDB, which usually means shadow IT or stale records. Every tool also names and formats the same host differently.
Approach
Treat the CMDB as the master list and each security tool as a comparison source. For every tool, ask which CMDB assets it is missing and which of its assets the CMDB does not know. Show the answer as a Sankey diagram for the shape of the gap, with a clickable hostname list for the work.
Real inventories cannot be published, so the public demo uses synthetic data only, from a generator included in the project.
How it works
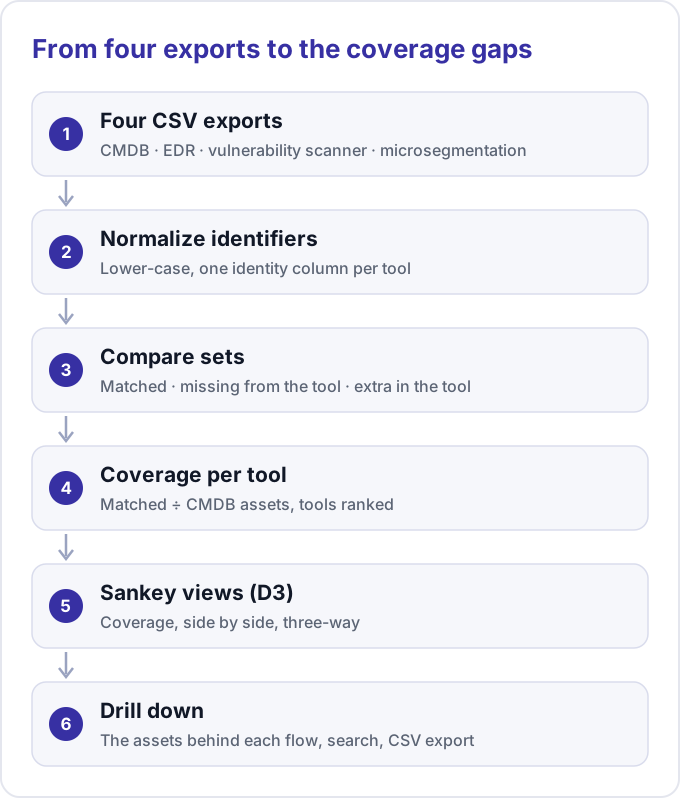
- Connectors read one CSV export per source: the CMDB, the EDR, the vulnerability scanner and the microsegmentation tool. Each names the column that identifies an asset, since every tool calls it something different.
- The engine lower-cases identifiers and compares sets: matched, missing from the tool (in the CMDB only) and extra (in the tool only).
- Coverage for a tool is matched assets divided by CMDB assets, and tools are sorted best to worst. The project’s guide reads above 80 percent as minor gaps, 50 to 80 percent as significant and below 50 percent as critical.
- A local web page draws the flows with D3: a coverage view from the CMDB through each tool to matched, missing and extra assets; a side-by-side view; and a three-way view with the CMDB in the middle, the EDR on one side and the vulnerability scanner on the other.
- Clicking a flow lists the assets behind it, with search by hostname or address and a CSV export. The page states whether it is showing test data.
Results
All figures come from the synthetic data set of 50 generated assets:
- 20 assets are in the CMDB, the EDR and the scanner.
- 10 are seen by both tools but absent from the CMDB.
- 8 are missing from the EDR and 7 from the scanner. In the generated data the first group is older legacy hosts and the second is recent cloud machines, which points to different fixes: agent rollout for one, scan scope for the other.
- 5 are deliberate edge cases: a blank hostname, two records sharing a hostname, a stale record and a non-ASCII hostname.
Three-way coverage is 20 of 38 distinct CMDB hostnames, or 52.6 percent, in the guide’s “significant gaps” band. The code reads whatever exports it is given; this page shows no result from a real inventory.
Lessons
- Identity matching is the hard part. Tools differ in column names and letter case, and blank, duplicate, stale and non-ASCII records quietly distort counts. Put those cases in the test data from the start.
- Define the denominator. Coverage is measured against the CMDB, so a stale CMDB looks like a coverage problem, and the “extra” list matters as much as the “missing” list.
- A diagram earns attention; a hostname list earns action. Every flow should lead to something an owner can fix.
- Next steps in the project notes: pull data from tool APIs instead of files, and keep history so trends show.